XRP Ledger has seen a spike in new addresses over the last 24 hours, but overhead resistance at $1.40 kept the XRP (XRP) price in check.
Key takeaways:
- XRP Ledger added 4,300 new wallets in 24 hours, marking the fourth-largest growth spike on the network in 2026.
- XRP price recovery may face resistance at $1.40, with a prolonged consolidation likely.
XRP Ledger sees fourth-largest growth spike in 2026
The XRP Ledger recorded one of its strongest growth surges of the year after adding 4,300 new wallets within 24 hours, the “fourth largest spike of 2026,” according to Santiment.
Related: XRP price may explode to $15 amid ‘quiet accumulation,’ analyst claims
The chart below shows that newly created XRP wallets increased to 4,300 on May 20, from about 2,500 on May 19. Similarly, daily active addresses increased to 43,520 from 32,000 over the same period.
“XRP is seeing one of its largest network growth stretches of the year,” the market intelligence firm said in a Thursday post on X, adding:
“Network growth is among the top leading signals to identify reversals.”
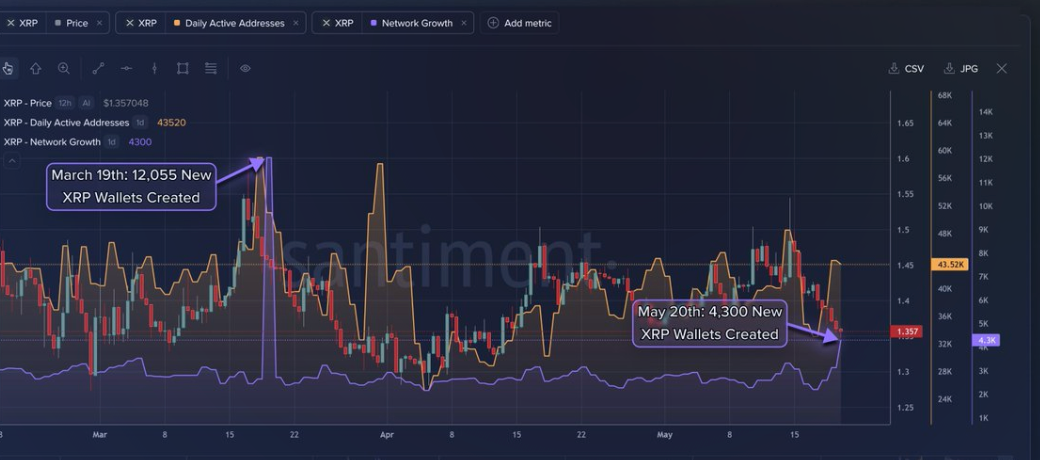
XRP Ledger active addresses and network growth. Source: Santiment
“When wallets rise like this, smart money pays attention,” analyst Amonyx commented, adding:
“$XRP reversal signal?”
Fellow analyst Niroshan682 said new wallet creation is often an “early signal of new network participation,” especially when it happens alongside growing institutional adoption and rising ETF inflows.
US-based spot XRP ETFs held about 1.34% of the XRP total supply after this month’s inflows. About $107.3 million worth of XRP ETFs flowed in May so far, with the $8.8 million in net inflows on Thursday marking the 12th straight day of positive flows.
This streak has pushed cumulative inflows to nearly $1.4 billion and assets under management (AUM) to $1.15 billion.
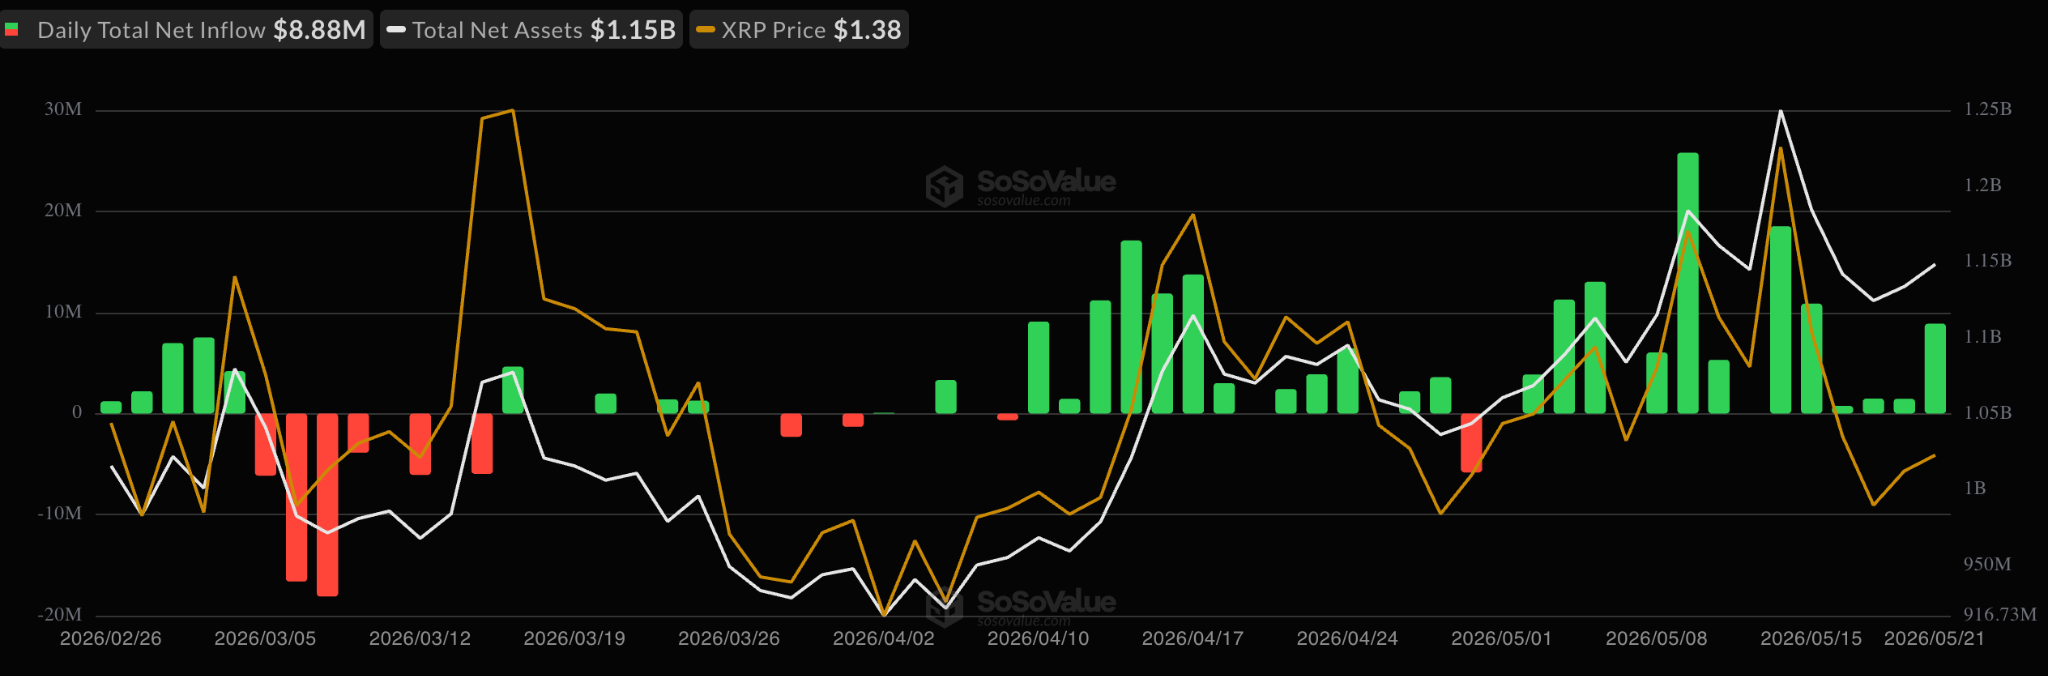
Spot XRP ETF flows chart. Source: SoSoValue
Despite these positive fundamentals, XRP/USD is down 1.5% over the last 24 hours, and remains 62% below its $3.66 multi-year high reached in July 2025.
XRP faces stiff overhead resistance
XRP’s latest 21% rally from the local low at $1.27 reached on April 5 stalled at $1.55, coinciding with the upper limit of a range that has capped its price action since early February.
Bulls must push the price above the $1.40-$1.55 resistance zone to confirm a breakout from consolidation. This area is also defined by the 50-day simple moving average (SMA), the 100-day SMA and the 100-day exponential moving average, as shown in the chart below.
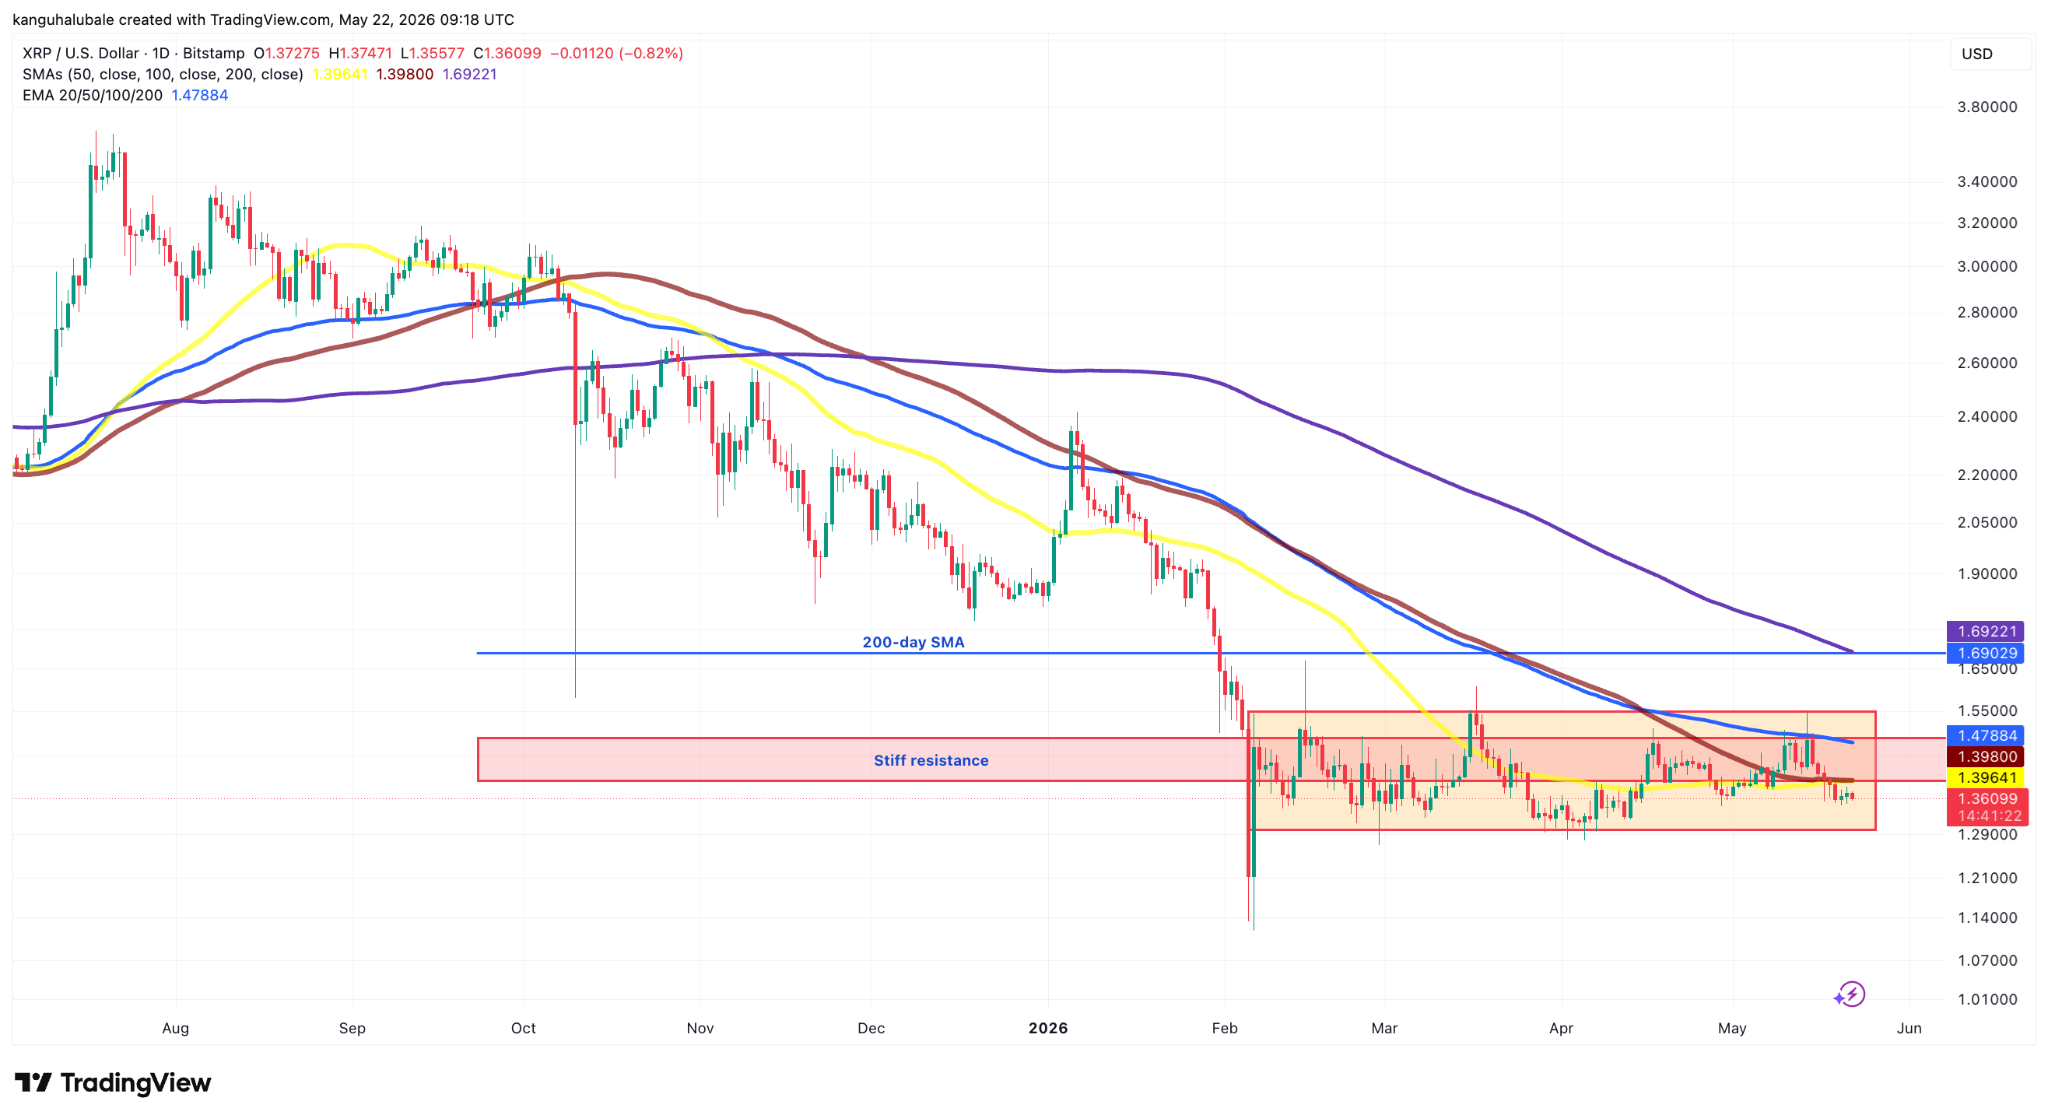
XRP/USD daily chart. Source: Cointelegraph/TradingView
According to XRP’s cost-basis distribution data, investors hold approximately 3.75 billion XRP at an average cost of $1.37-$1.45, creating a potential resistance zone.
This concentration suggests many investors may sell at break-even, potentially stalling XRP’s upward momentum.
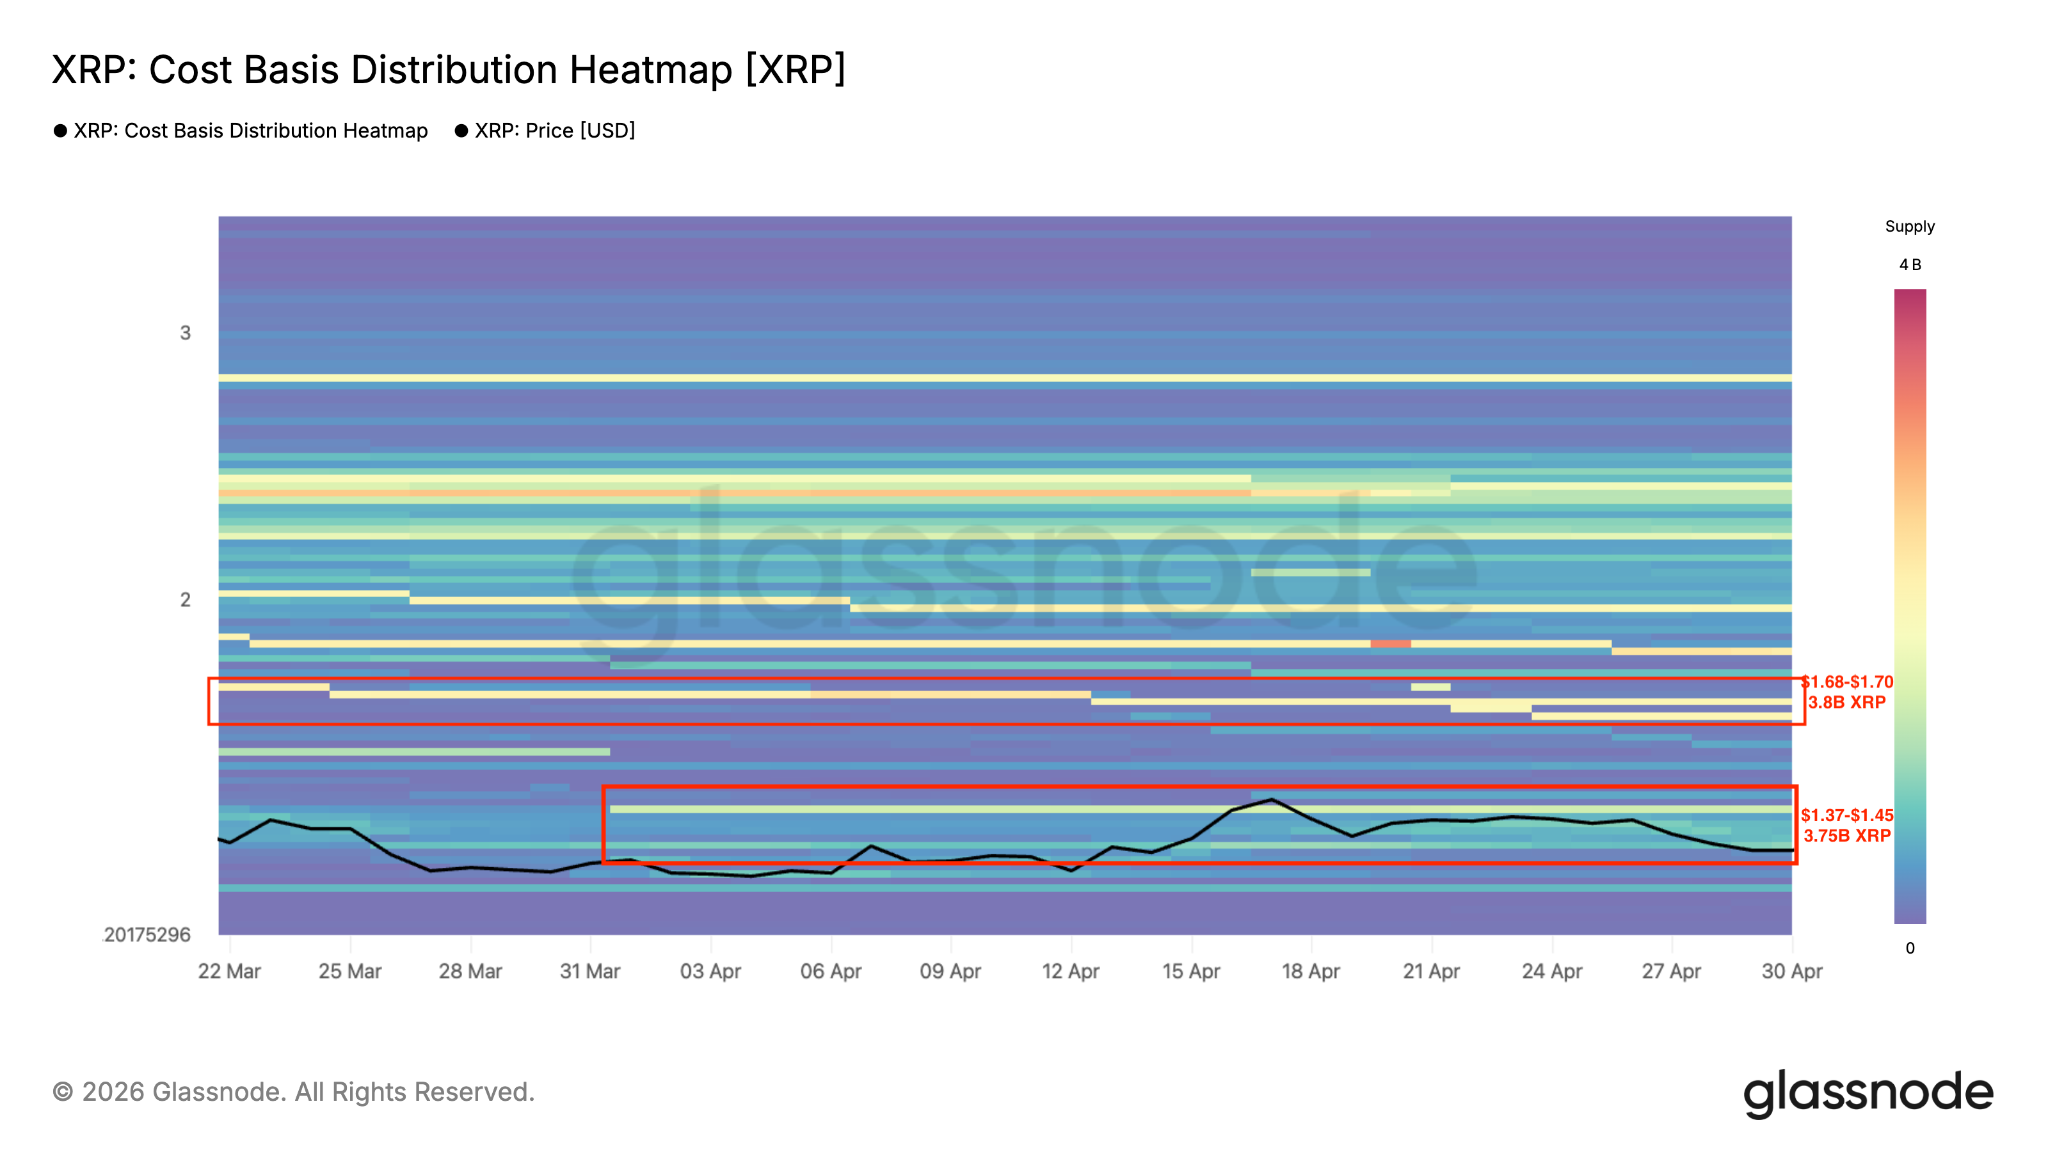
XRP cost basis distribution chart. Source: Glassnode
Another supply congestion zone is higher up at $1.68-$1.70, where investors bought approximately 3.8 billion XRP. This level coincides with the upper boundary of a falling wedge pattern, which is setting up the XRP/USD pair for a breakout, according to analyst Crypto Michael.
Note that a weekly close above the wedge’s upper trend line could open the way for a rally toward the measured target at $3.52, about 50% above the current price.
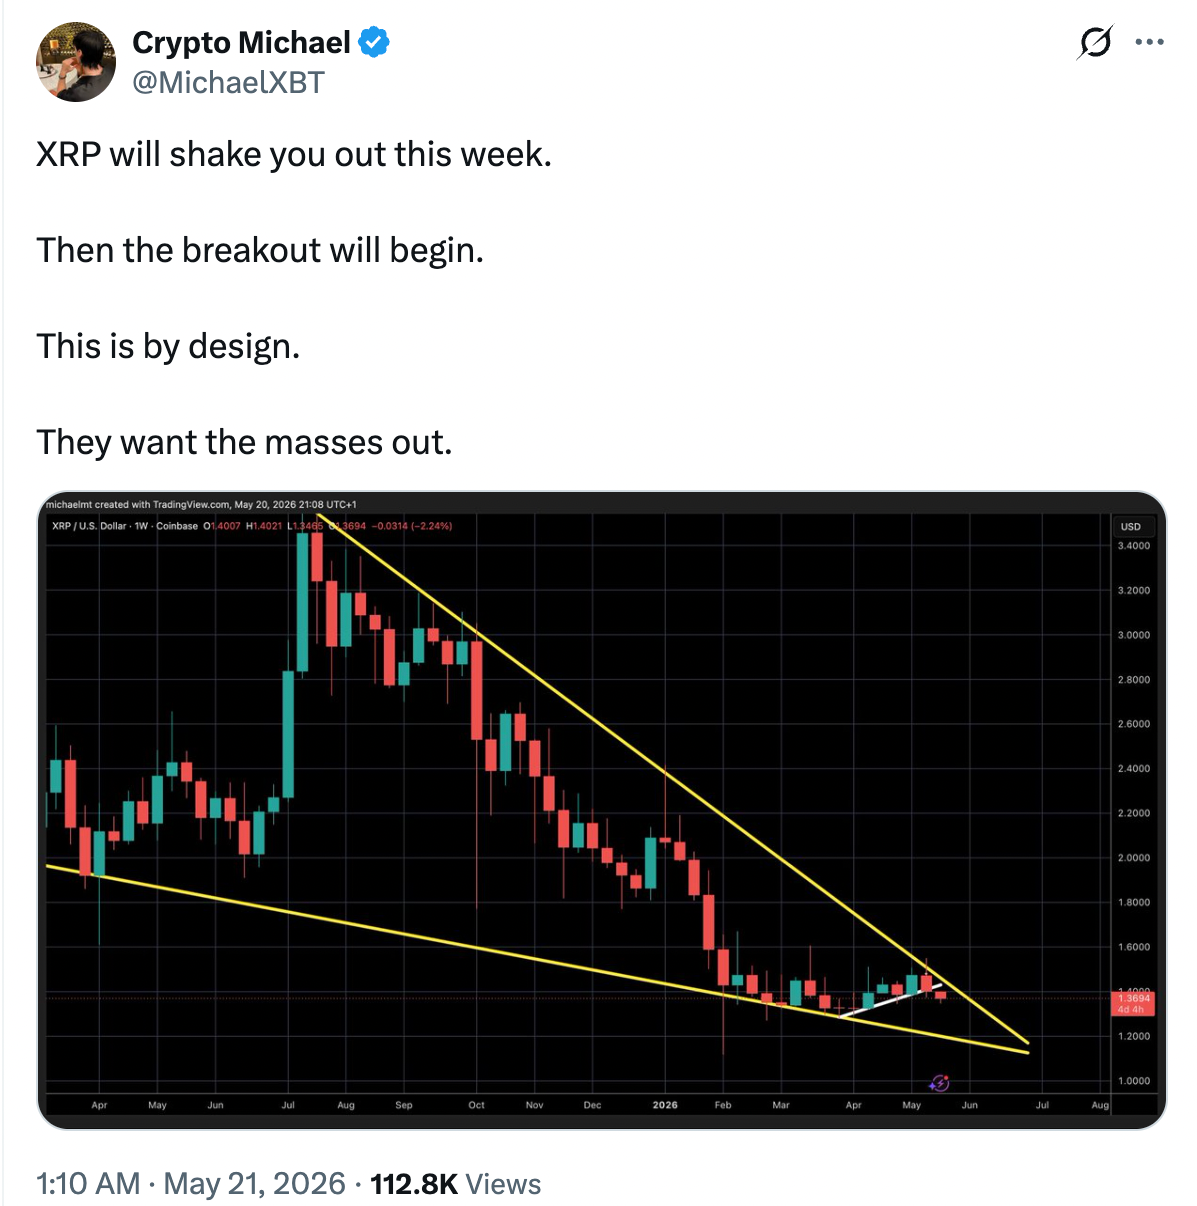
XRP/USD weekly chart. Source: Crypto Michael.
As Cointelegraph reported, buyers will have to push XRP/USD above the multi-month trend line at $1.40 to signal a comeback, while a close above $1.61 would confirm a potential trend change.