Nuclear leakage detection and radiation monitoring have become critical as the world generates increasing amounts of nuclear waste. Almost every country produces nuclear waste, whether from power generation or defense applications. If this waste contaminates food sources or ocean water, it can have devastating consequences for marine life, humans, animals, and the environment.
Continuous monitoring of radiation levels is essential to prevent such risks. A portable, wireless IoT-based nuclear radiation monitoring system can help measure radiation levels in real time and provide instant alerts in case of abnormal exposure.
Earlier, we designed a nuclear radiation monitoring device that worked on a local network. However, such systems are not suitable for long-range or remote deployment. In real-world scenarios, radiation monitoring requires long-distance, remote-access capabilities so that users can safely track radiation levels without being physically present in hazardous areas.

To address this challenge, we use the IndusBoard Coin, a compact and portable development board with built-in Wi-Fi connectivity. This device connects to a network (such as JioFiber) to deliver real-time radiation data on a local web interface. It also sends data to cloud platforms like ThingSpeak, enabling remote monitoring from anywhere in the world.
Whether deployed in a laboratory or near a high-risk zone, this IoT-based radiation detection system ensures continuous tracking and instant updates on radiation levels. In the following sections, we will explore how to set up and use this system effectively.
What’s a Geiger-Müller Tube?
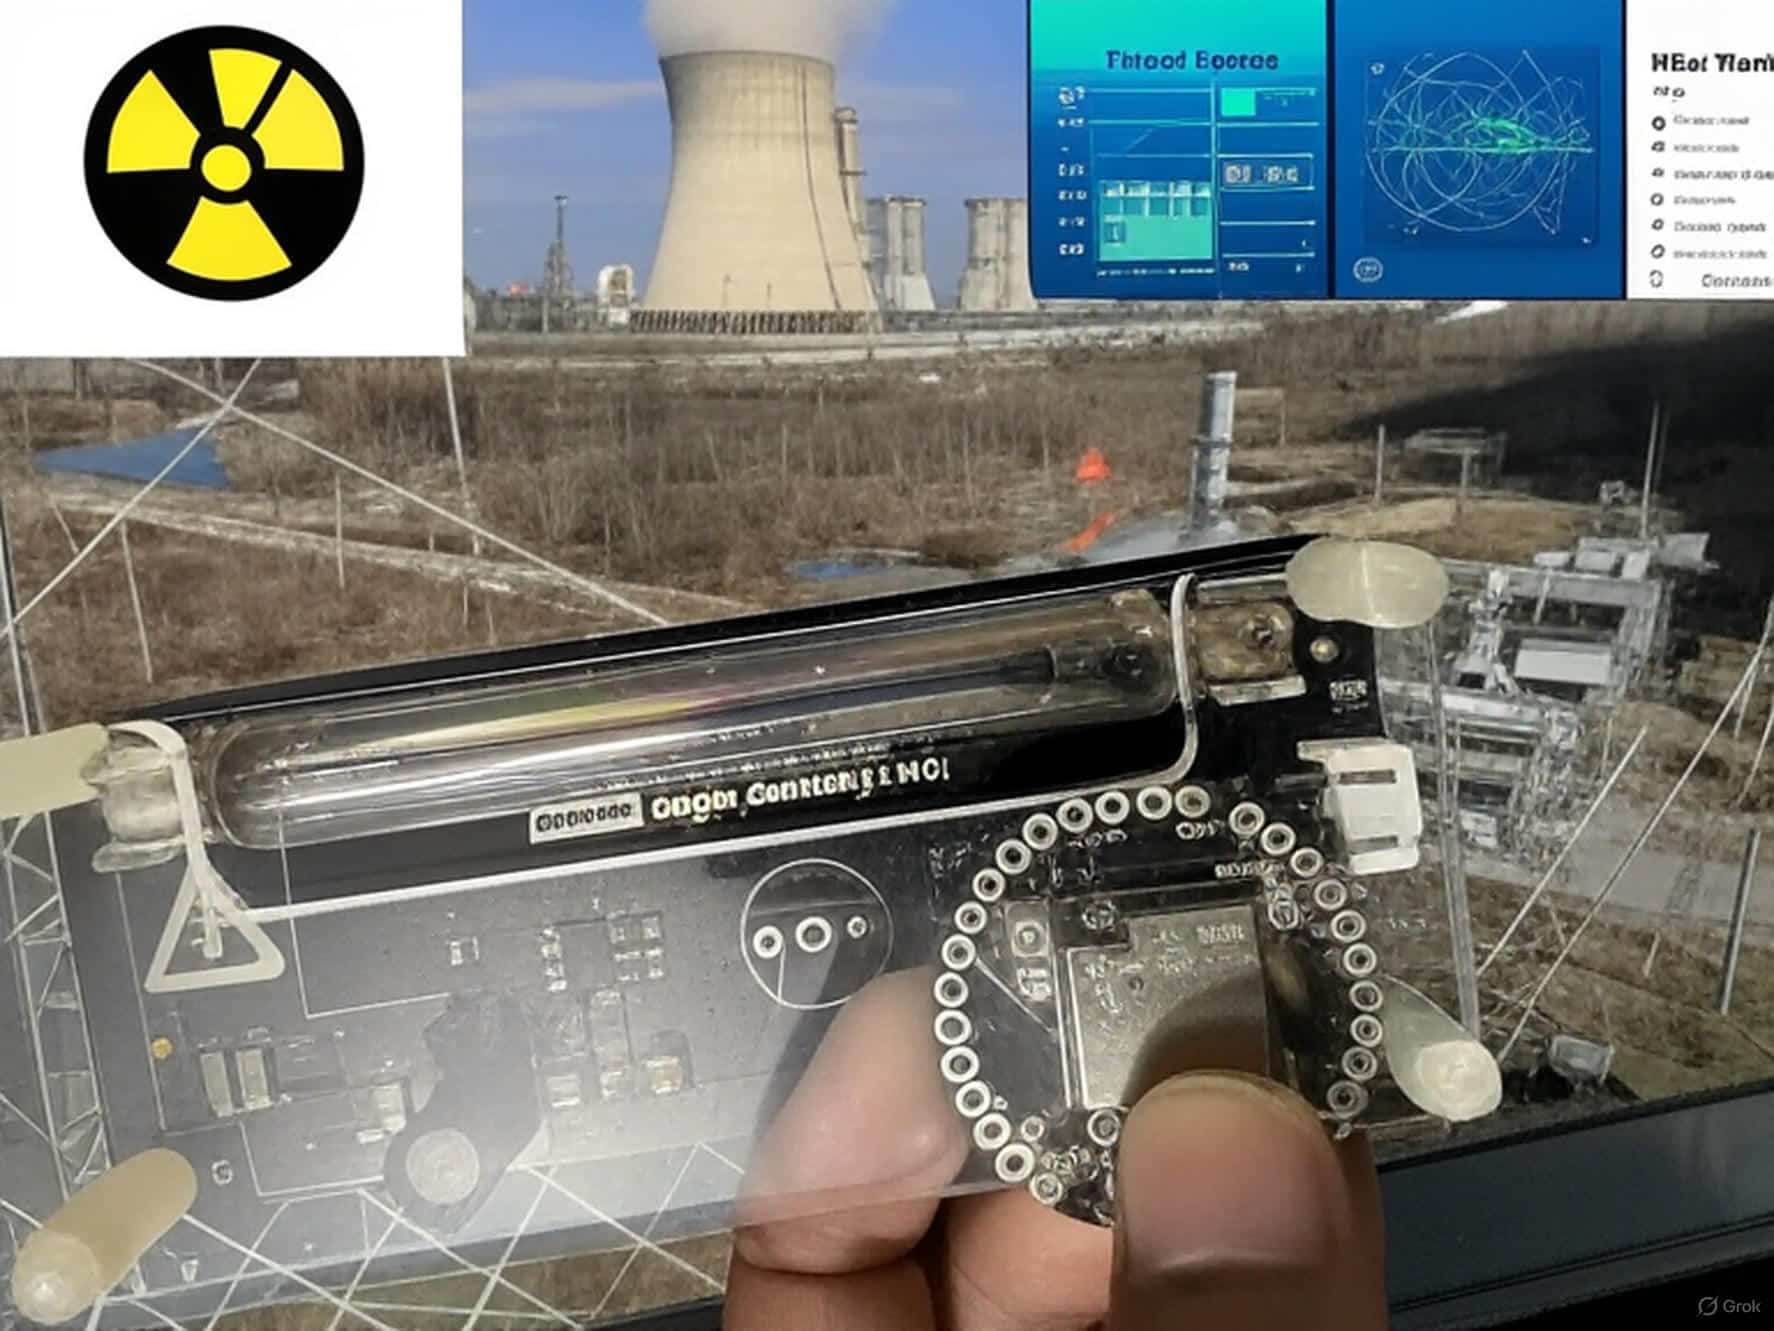
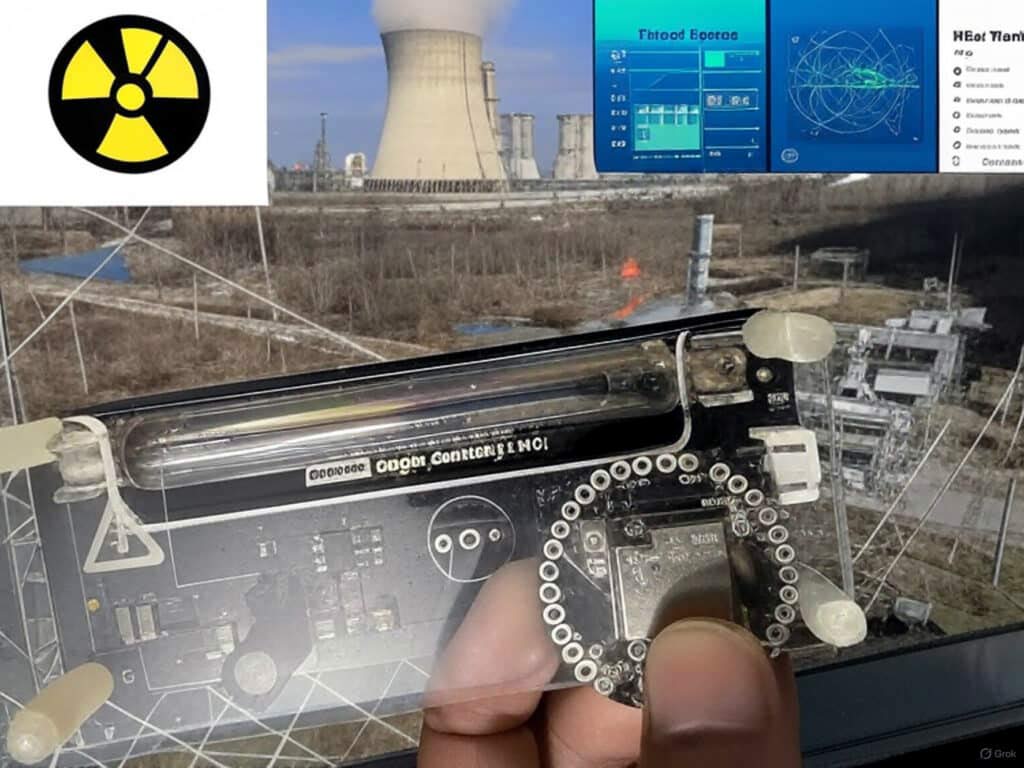
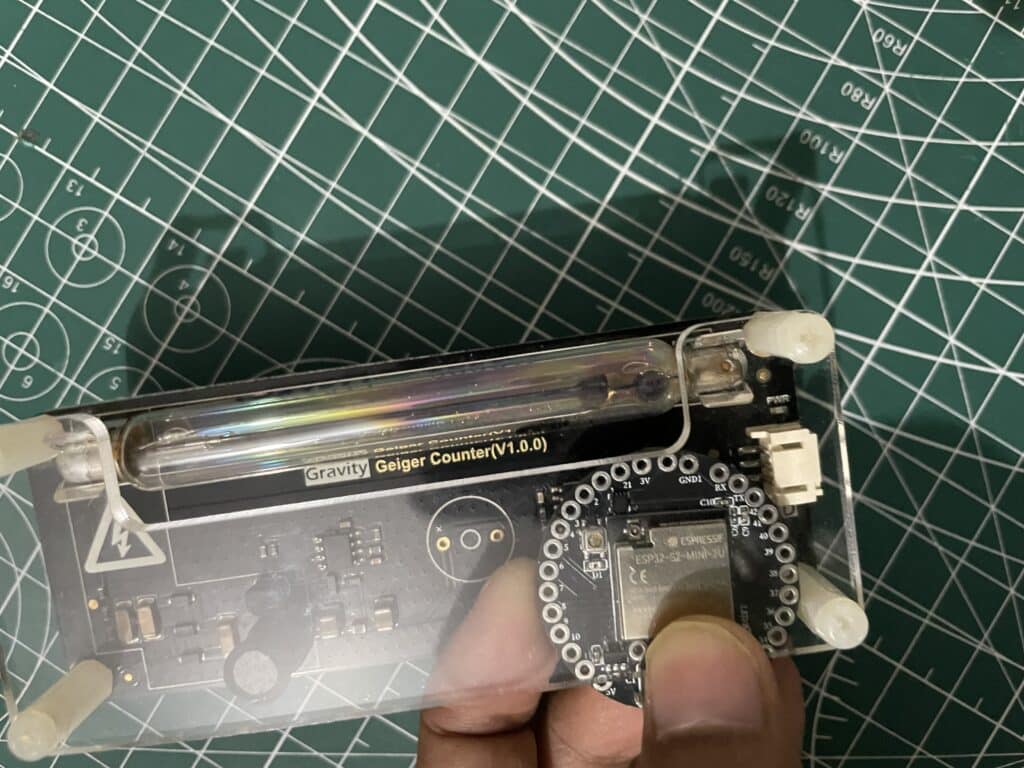
So, the star of our device is this thing called a Geiger-Müller tube, or GM tube—ours is the M4011. Think of it as a tiny glass tube filled with a special gas, like neon or argon, that’s ready to catch radiation. When alpha (α), beta (β), or gamma (γ) rays zip through, they make the gas spark with little electrical pulses.
We count those pulses to get a number called CPM (Counts Per Minute), which tells us how much radiation is around. The M4011 is great because it can detect all three types—alpha, beta, and gamma—though it’s especially sharp with beta and gamma rays.
We use a simple math trick (1 CPM ≈ 5 nSv/h for the M4011) to turn CPM into nanosieverts per hour (nSv/h) and microsieverts per hour (μSv/h). It’s like having a radiation detective that spots leaks or just keeps an eye on normal background levels, whether we’re in a lab or out in the open.
Bill of Materials
| Component | Part number | Quantity |
| IndusBoard Coin | Coin V2 | 1 |
| Muller Tube | M4011, J305 | 1 |
| Power adapter 1A 5V | 1 | |
| Giger Counter Module | DF Robot | 1 |
Setting Up ThingSpeak for Remote Nuclear Radiation Monitoring
Before coding the remote monitoring system, we first need to configure ThingSpeak so we can monitor nuclear radiation data from anywhere in the world.
ThingSpeak acts as a cloud platform for storing and visualizing real-time radiation data. Follow these steps to set it up:
Step 1: Sign In to ThingSpeak
Go to and log in to your account.
Step 2: Access Your Channel
Navigate to your channel using:
/channels/2990874
This is where your radiation data will be stored and displayed.
Step 3: Configure Data Fields
Ensure your channel includes the following three fields:
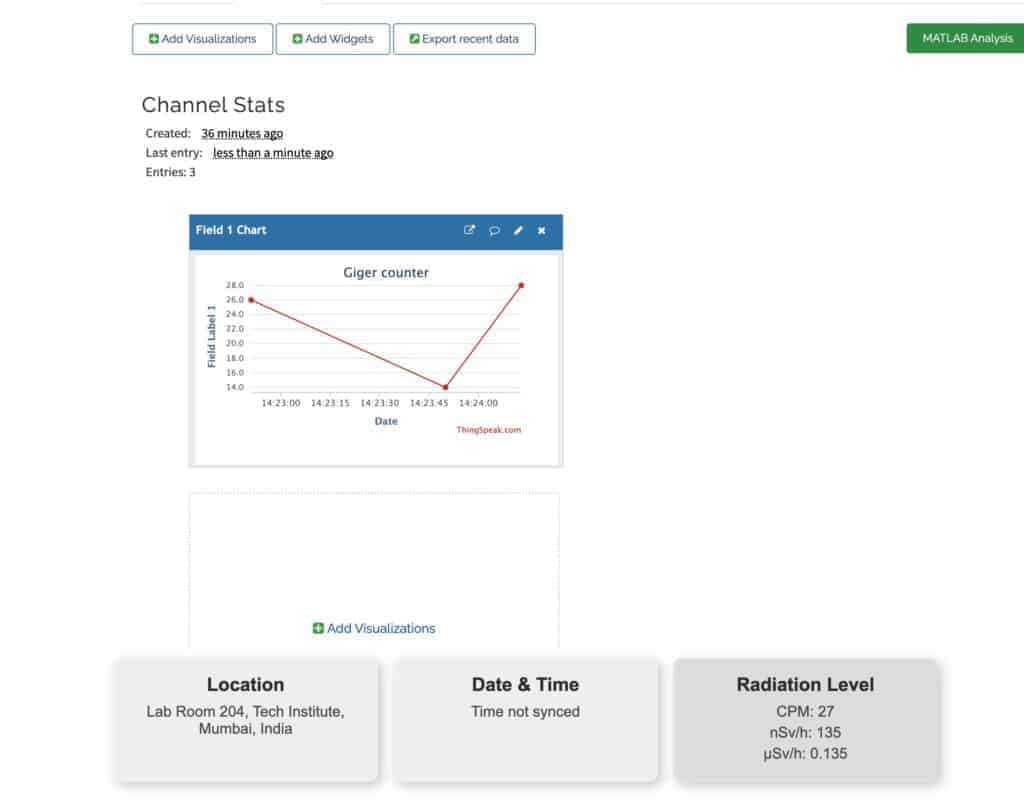
- Field 1: CPM (Counts Per Minute)
- Field 2: nSv/h (Nanosieverts per Hour)
- Field 3: μSv/h (Microsieverts per Hour)
If any field is missing, go to Channel Settings and add the required fields.
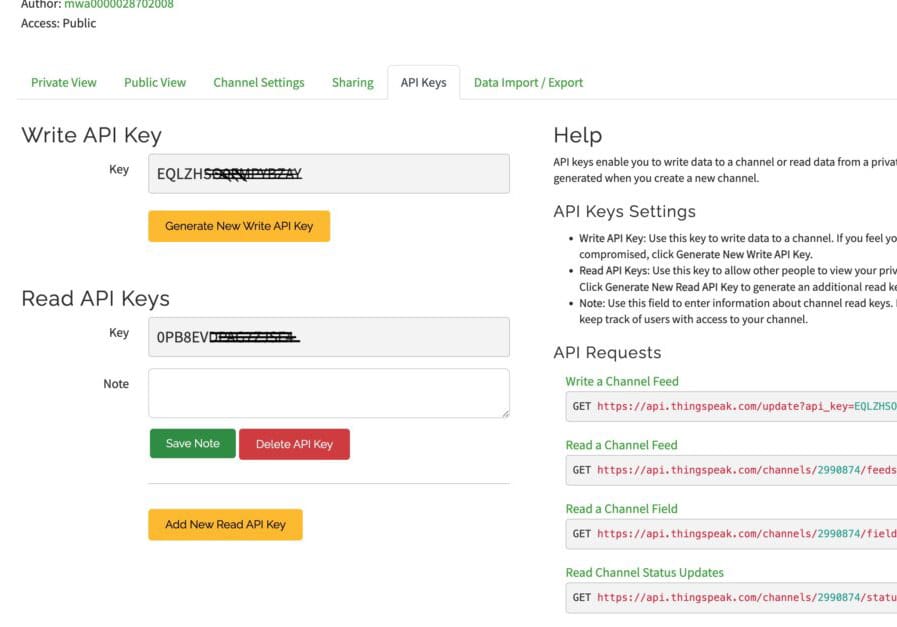
Step 4: Verify API Keys
API keys allow your IoT device to send and retrieve data from ThingSpeak.
- Write API Key: EQLZHSO0EMPYBZAY (used to send data)
- Read API Key: 0PB8EVDPAG7ZJSF4 (used to fetch data later)
You can find these under the API Keys tab. If the keys do not match, regenerate them.
Step 5: Enable Data Visualization
Enable line graphs for each field to visualize radiation trends over time.
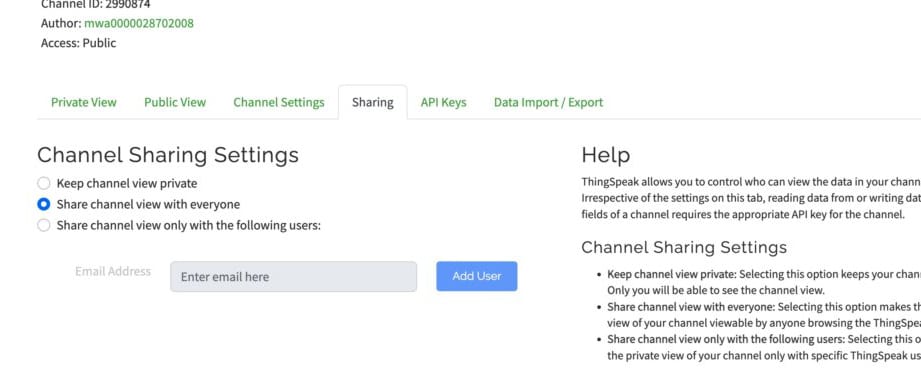
You can also choose to make your channel public or private, depending on your preference.
Why This Setup Matters
This configuration enables your IoT-based nuclear radiation monitoring system to:
- Send real-time radiation data to the cloud
- Monitor radiation levels remotely
- Analyze trends and detect anomalies instantly
Building an IoT Dashboard for Real-Time Nuclear Radiation Monitoring
To design an IoT dashboard for displaying nuclear radiation data along with the deployment location, we need to create code that hosts a webpage showing real-time radiation readings. The system reads data from a Geiger-Müller (GM) tube, calculates radiation levels, and updates the dashboard hosted on the development board.
Step 1: Install the Geiger Counter Library
First, download the DFRobot Geiger counter library.
Copy the folder (DFRobot_Geiger) into the Arduino libraries directory:
Documents → Arduino → libraries
Step 2: Sensor Data Processing and Web UI Integration
Next, we write code to:
- Read data from the Geiger sensor
- Convert raw readings into meaningful radiation units
- Display the data in real time on a web-based dashboard
IoT Dashboard Features
The Arduino code running on the IndusBoard Coin performs the following functions:
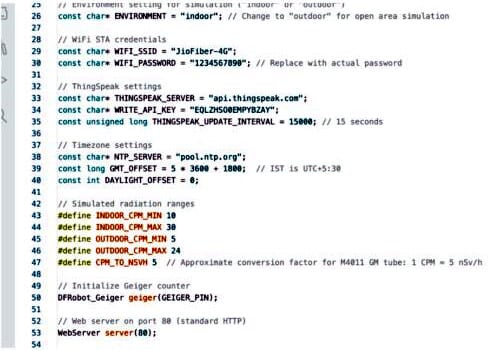
- Connects to Wi-Fi (e.g., JioFiber-4G) in STA mode
- Sends radiation data to ThingSpeak every 15 seconds
- Hosts a local webpage with a clean UI (white background and card-based layout)
- Displays real-time radiation values
If the Geiger sensor is not connected or returns zero readings, the system simulates realistic values for testing:
- Indoor: 10–30 CPM, 50–150 nSv/h
- Outdoor: 5–24 CPM, 25–120 nSv/h
These values are calculated using the M4011 conversion factor:
Code Overview: How the System Works
1. Libraries and Configuration
The code includes libraries for:
- Geiger counter module
- Wi-Fi connectivity
- Web server
- ThingSpeak integration
You must configure the following in the code:
WIFI_SSIDandWIFI_PASSWORD- ThingSpeak Write API Key (required for sending data)
2. System Initialization (setup())
The setup() function:
- Starts serial communication
- Initializes the Geiger counter
- Connects to Wi-Fi
- Sets Indian Standard Time (IST)
- Launches the web server
3. Main Execution Loop (loop())
The loop() function:
- Keeps the web server running continuously
- Sends data to ThingSpeak every 15 seconds
- Automatically reconnects to Wi-Fi if disconnected
4. Local Web Dashboard
handleRoot()serves the main webpage- Displays location, time, and radiation levels using card-style UI
handleData()sends JSON data every second to keep the dashboard updated in real time
5. ThingSpeak Integration
The sendToThingSpeak() function:
- Sends CPM, nSv/h, and μSv/h values to the ThingSpeak cloud
- Uses HTTP requests for data transmission
Why This Setup Is Important
This IoT-based system enables:
- Real-time nuclear radiation monitoring
- Remote data access via cloud platforms
- Continuous tracking and instant updates
- Safe monitoring from hazardous environments
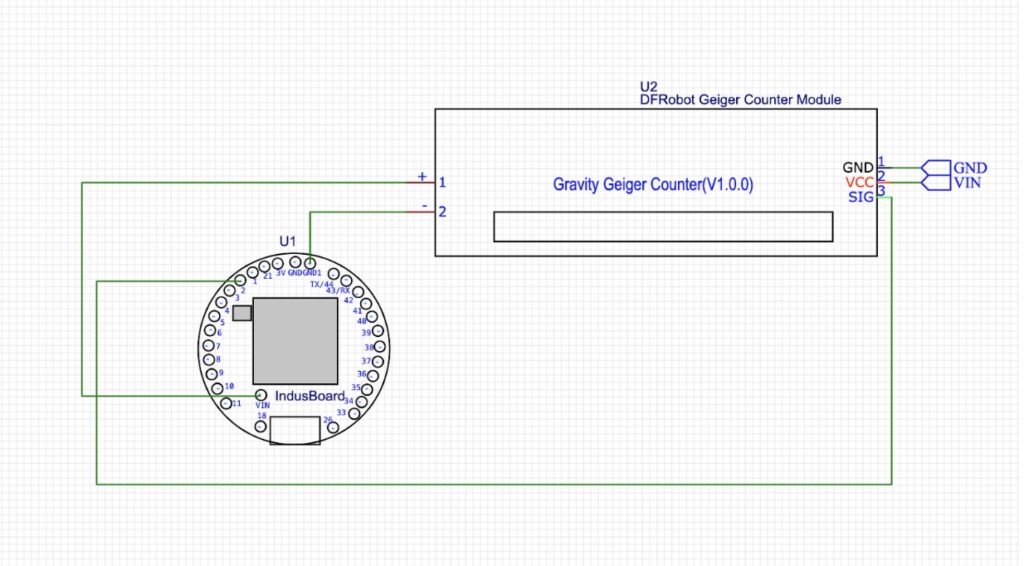
Circuit Connection for Geiger Sensor with IndusBoard
The circuit design is very simple. You only need to connect the sensor output pin to any available I/O pin on the IndusBoard, as defined in the code.
You can use any free GPIO pin, but make sure the selected pin number matches the configuration specified in your program.
Powering the Device and Testing the IoT Radiation Monitoring System
Now power the device using either a battery or a USB adapter.
If you are using a battery, connect it to the 3V pin and GND pin on the board.
It’s time to see the device in action. First, we will test the local webpage dashboard, and then verify that the data is being sent to ThingSpeak for remote monitoring.
Local Webpage Dashboard (STA Mode)
Step 1: Connect to Wi-Fi
Connect your phone or laptop to the Wi-Fi network (e.g., “JioFiber-4G”).
Step 2: Find the IP Address
- Open the Serial Monitor in Arduino IDE (baud rate: 115200)
- Look for a message like:
WiFi connected. IP Address: 192.168.1.100 (may vary)
Step 3: Access the Dashboard
Open a web browser and enter:
http://(e.g.,- Or try:
(if mDNS is enabled)
Step 4: Dashboard Output (Updates Every Second)
You will see:
- Location: Lab Room 204, Tech Institute, Mumbai, India
- Date & Time: Current IST (e.g., Monday, June 16, 2025, 14:33:00)
- Radiation Levels:
- Indoor Mode:
- CPM: 10–30
- nSv/h: 50–150
- μSv/h: 0.05–0.15
- Outdoor Mode:
- CPM: 5–24
- nSv/h: 25–120
- μSv/h: 0.025–0.12
- Indoor Mode:
The dashboard features a clean white interface with three card-style sections and a subtle 3D hover effect.
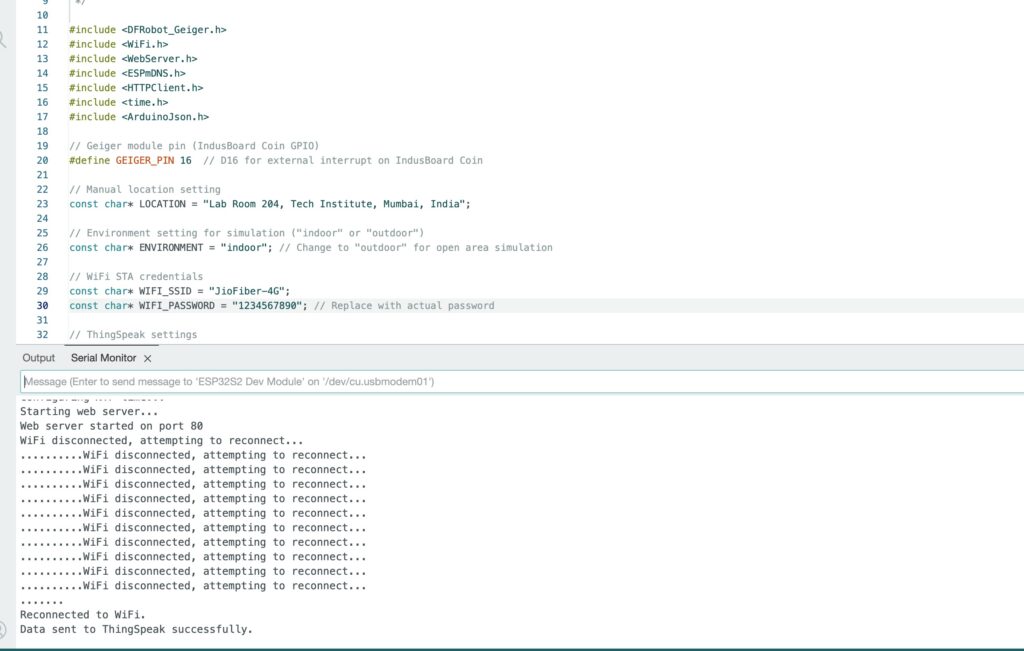
Step 5: Serial Monitor Output
- Real Sensor Data:
Sensor reading: CPM=15, nSv/h=75, μSv/h=0.075 - Simulated Data (if sensor is not connected):
Sensor reading 0, simulating radiation data...
ThingSpeak Cloud Dashboard (Remote Monitoring)
Step 1: Open ThingSpeak
Visit: /channels/2990874
Step 2: Verify Data Updates
New data should appear every 15 seconds:
- Field 1: CPM (5–30)
- Field 2: nSv/h (25–150)
- Field 3: μSv/h (0.025–0.15)
Use the graphs to analyze radiation trends over time.
Step 3: Serial Monitor Feedback
- Success Message:
Data sent to ThingSpeak successfully - Error Message:
Failed to send to ThingSpeak. HTTP code:
(Note: HTTP code 200 indicates a successful request)
Why This Step Matters
This final setup ensures that your IoT-based nuclear radiation monitoring system:
- Displays real-time data locally
- Sends data to the cloud for remote access
- Provides continuous monitoring and alerts